A Gentleman and a Scala
Understanding math through code
Archive
- Between order and chaos
- Probability is in the process
- The quantum eraser demystified
- Is the NBA draft rigged?
- Programming with futures: patterns and anti-patterns
- Good Tech Lead, Bad Tech Lead
- Bayesian networks and causality
- Unlikely things happen all the time
- The Foursquare Theorem
- Painless, effective peer reviews
- Infinite lazy polynomials
- Exact numeric nth derivatives
- Impossible functions
- Understanding A/B test analysis
- How traffic actually works
- Unevaluating polynomials
- Insertion sort is dual to bubble sort
- The 3 Things You Should Understand about Quantum Computation
- Fun with Bayesian Priors
- A Programmer's Guide to the Central Limit Theorem
- Climbing the probability distribution ladder
- A frequentist approach to probability
Between order and chaos
Consider a population of rabbits and foxes. The number of rabbits and the number of foxes will range between 0 and 1, representing the percentage of some theoretical maximum population. Each generation, the number of rabbits and foxes changes according to a simple rule.
The number of rabbits in generation , based on the number of rabbits and foxes in the previous generation , is given by:
The constant is the rabbits’ birth rate. For example, if , then each rabbit produces 2 offspring in the next generation. The factor accounts for deaths due to starvation and predation. If the number of rabbits is low, then few will die of starvation, if it’s high then many will; and likewise if the number of foxes is high, many rabbits will die from being eaten.
The number of foxes in the next generation is given by:
This says that the chance that a fox encounters and eats a rabbit is . So if the rabbit population is at 80% of its theoretical maximum, 80% of foxes will eat enough to reproduce, and will produce offspring.
So let’s pick some values for and and see how the system behaves. We’ll visualize it by plotting the populations on a graph. But instead of plotting both populations over time, we’ll plot the populations against each other. That is, we’ll leave time out of it and just plot the set of points over, say, 40,000 generations.
Let’s see what we get.
Read moreProbability is in the process
I came across an old post by Eliezer Yudkowsky on Less Wrong entitled Probability is in the Mind. It immediately struck me as, well, more wrong, and I want to explain why.
A brief disclaimer: that article was published 8 years ago and he may have changed his thinking since then, but I’m purely out to address the idea, not the person. So here goes.
First I’ll lay out his argument, which he does through a series of examples.
Read moreThe quantum eraser demystified
The quantum eraser is a variation on the classic double-slit experiment. If you ever have any doubt about the weirdness of quantum mechanics (“oh, there’s probably some classical explanation for all of this”), this experiment is designed to remove it.
The experiment involves two entangled polarized photons. The first goes straight to a detector, and the second passes through a barrier with two slits before reaching a detector.
The experiment proceeds in three stages. I’m going to simulate each stage using my toy quantum computing library (see earlier post here), and we’ll see what happens!
Read moreIs the NBA draft rigged?
Had a chat with @jliszka about Bayes' rule, the '14 draft lottery, & the chances the NBA is rigged. Now I don't believe in anything anymore.
— harryh (@harryh) July 11, 2014This chat basically consisted of Harry mentioning that the Cleveland Cavaliers got the first pick in the draft, even though the lottery gave them only a 1.7% chance of drawing that slot, then wondering aloud how he should update his prior on whether the NBA draft is rigged given this information, and then me breaking out my probability monad, because there’s no problem that can’t be solved with more monads.
Read moreProgramming with futures: patterns and anti-patterns
Twitter’s Future library is a beautiful abstraction for dealing with concurrency. However, there are code patterns that seem natural or innocuous but can cause real trouble in production systems. This short article outlines a few of the easiest traps to fall into.
An example
Below is a method from a fictional web application that registers a user by calling the Foursquare API to get the user’s profile info, their friend graph and their recent check-ins.
def registerUser(token: String): Future[User] = {
  val api = FoursquareApi(token)

  def apiFriendsF(apiUser: ApiUser): Future[Seq[ApiUser]] = {
    Future.collect(apiUser.friendIDs.map(api.getUserF))
  }

  def apiCheckinsF(apiUser: ApiUser, categoryies: Seq[ApiCategory]): Future[Seq[ApiCheckin]] = {
    ...
  }

  def createDBUser(
      user: ApiUser,
      friends: Seq[ApiUser],
      checkins: Seq[ApiCheckin]): User = {
    db.insert(...)
  }

  for {
    apiUser <- api.getSelfF()
    apiCategories <- api.getCategoriesF()
    apiFriends <- apiFriendsF(apiUser)
    apiCheckins <- apiCheckinsF(apiUser, apiCategories)
  } yield createDBUser(apiUser, apiFriends, apiCheckins)
}
There are some problems with this code.
Read moreGood Tech Lead, Bad Tech Lead
A brief guide to tech leadership at Foursquare, inspired by Ben Horowitz’s Good Product Manager, Bad Product Manager. Cross-posted from Medium.
Teamwork
Good tech leads act as a member of the team, and consider themselves successful when the team is successful. They take their share of unsexy grungy work and clear roadblocks so their team can operate at 100%. They work to broaden the technical capabilities of their team, making sure knowledge of critical systems is not concentrated in one or two minds.
Bad tech leads take the high-profile tasks for themselves and are motivated by being able to take credit for doing the work. They optimize locally, keeping team members working on projects that benefit the team at the expense of the engineering organization at large.
Technical vision
Good tech leads have an overall vision for the technical direction of the product and make sure the team understands it. They delegate feature areas to other team members and let them own their decisions. They recognize that their team members are smart, trust them, and rely on them to handle significant pieces of the project.
Bad tech leads resist explaining or clarifying the technical direction and dictate decisions instead. They keep critical institutional knowledge in their heads, failing to multiply their effectiveness by creating and disseminating helpful documentation.
Read moreBayesian networks and causality
Correlation does not imply causality—you’ve heard it a thousand times. But causality does imply correlation. Being good Bayesians, we should know how to turn a statement like that around and find a way to infer causality from correlation.
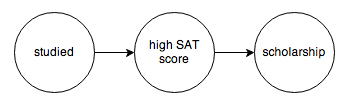
The tool we’re going to use to do this is called a probabilistic graphical model. A PGM is a graph that encodes the causal relationships between events. For example, you might construct this graph to model a chain of causes resulting in someone getting a college scholarship:
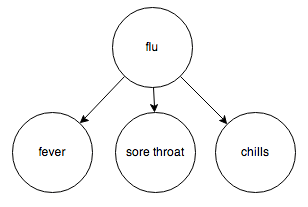
Or the relationship between diseases and their symptoms:
Or the events surrounding a traffic jam:
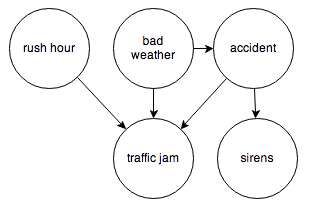
Each node represents a random variable, and the arrows represent dependence relations between them. You can think of a node with incoming arrows as a probability distribution parameterized on some set of inputs; in other words, a function from some set of inputs to a probability distribution.
PGMs with directed edges and no cycles are specifically called Bayesian networks, and that’s the kind of PGM I’m going to focus on.
It’s easy to translate a Bayesian network into code using this toy probability library. All we need are the observed frequencies for each node and its inputs. Let’s try the traffic jam graph. I’ll make up some numbers and we’ll see how it works.
Read moreUnlikely things happen all the time
Yesterday I received an unexpected media query from Jen Doll, a journalist at New York Magazine, reporting on the story where Frank Bruni found Courtney Love’s iPhone in a taxi. She was musing about the statistical likelihood of an event like that, and somehow found this twitter thread where I had calculated the probability of getting the same cab driver twice. She wanted to know how I arrived at my figures and whether I had any additional insight on the question.
So of course I wrote her back a whole essay, and today there’s this article. Her editors had cut it way down, because journalism. But I had put all this work into it, so I thought I’d post it here.
The text of my reply is below.
Read moreThe Foursquare Theorem
This has nothing to do with the playground game, the church, or the mobile/social/local city guide that helps you make the most of where you are. (Disclosure: I work at Foursquare.)
This is about Lagrange’s four-square theorem, which states that every natural number can be expressed as the sum of four squares. For example,
The proof given on the Wikipedia page is only an existence proof, but I was able to find a mostly constructive proof elsewhere online. I want to present an outline of the proof along with some code that carries out the construction. Here’s a preview:
*Main> foursquare 123456789
(-2142,8673,6264,-2100)
Painless, effective peer reviews
Peer reviews are the most effective kind of feedback — only your peers really know what it’s like to work with you, and they have the most insightful, nuanced and helpful suggestions for improvement. Almost every tech company I can think of does them as part of their annual review process. The problem is that everyone hates writing them, because decent feedback takes a really long time to write, sometimes on the order of 4 or 5 hours for a single peer review.
I’d like to solve this problem. Most people think that there’s a natural, unavoidable relationship between quality and time spent. But that overlooks an important point — the thing that makes writing peer reviews difficult is: writing itself.
The interview method
Here are 5 easy steps to collecting insightful, critical, honest peer review feedback, in about an hour:
Read more